SQLSaturday Twin Cities is October 12th 2013, a great day of SQL Training, Networking, Prizes and Fun.
I will be presenting on Table Partitioning for Archiving this year, so stop by and say hi!
Click Here to see the full schedule
Showing posts with label SQLSaturday. Show all posts
Showing posts with label SQLSaturday. Show all posts
Friday, September 13, 2013
Tuesday, August 20, 2013
PowerShell Progress Meter
In many of my past PowerShell scripts, I've included my own home-spun progress report in the results window. I like that a lot, but my mind was blown when I noticed that there is a "Write-Process" cmdlet...with some re-tweaking I made it rock and much more efficient.
So the situation where you would want to use this is if you are looping over a large dataset and it takes a while to bring back results (I often will use PowerShell to hit all the servers I control, get some information about them and return it to me (backup status, if they are VM's, configuration info, etc). It can take 20+ minutes to get to all the servers and it is nice to know how far along the process is; thats where this comes in handy.
Some things to keep in mind...You need to have some resultset to work with, it doesn't have to be a query, but it does have to be some kind of System.Array. After you generate the Array, run this bit of code...I'm calling my array "results":
<################################
 ##  SETUP PROGRESS VARIABLES  ##
 ################################>
$ResultsLen = $results.Length
$LastPercentComplete = 0
[datetime]$DateStart = Get-Date -format G
This sets up some of the variables we will need inside the progress meter. Next, just after you issue your "foreach ($result in $results) {" You run the following code:
<##########################
 ##  RUN PROGRESS METER  ##
 ##########################>
foreach ($result in $results)
{
 $currentRow++
 $PercentComplete = [math]::floor(($CurrentRow/$ResultsLen)*100)
 [datetime]$DateNow = Get-Date -format G
 $diff = $DateNow-$DateStart
 $DiffSeconds = $diff.TotalSeconds
 $SecondsPerRecord = $DiffSeconds/$currentRow
 $RemainingSeconds = $SecondsPerRecord*($ResultsLen-$currentRow)
 $SecondsPerRecord = [Math]::Round($SecondsPerRecord,2)

 Write-Progress -Activity "Investigating Servers..." `
  -PercentComplete $PercentComplete `
  -SecondsRemaining $RemainingSeconds `
  -CurrentOperation "Current Row: $currentRow / $ResultsLen.   Seconds/Record: $SecondsPerRecord   Run Time (seconds): $DiffSeconds" `
  -Status "Please wait."

 Remove-Variable DateNow
 Remove-Variable DiffSeconds
 Remove-Variable SecondsPerRecord
 Remove-Variable RemainingSeconds
}
You don't need to remove your variables, I just like to do it to clean up my code, I do this at the bottom of the script:
Remove-Variable ResultsLen
Remove-Variable currentRow
Remove-Variable LastPercentComplete
Remove-Variable DateStart
Want to see it in action? Take my script and add this to the top of it (creates an array with 10000 items, which should keep the status bar up long enough for you to see):
$results = 1..10000
This looks awesome in PowerGUI, which is what I use for PowerShell Development, it looks a bit funky in the native PS window, but good enough to get you the idea. If you aren't using PowerGUI, give it a shot, it's free. http://www.powergui.org
As always, please leave comments below if you find this useful or have other suggestions. It's nice to know people read these posts.
Wednesday, April 24, 2013
SQL Saturday 175 is this weekend!
I'm pretty excited about the SQL Saturday in Fargo this weekend. I've spent a lot of time polishing my presentation on Table Partitioning and getting it all ready for this event. I'm looking forward to spending some time with several SQL Friends, and hopefully meeting some cool SQL people from the Fargo area. All-in-all, this should be a fantastic weekend.
Saturday, November 12, 2011
SQLSaturday #99 Scripts
Hello to everyone who finds my blog because of taking my SQLSaturday presentation on Execution Plans. As promised, I'm attaching my scripts.
What are Execution Plans?
The definition I used in my presentation was:
"In simplest terms, Execution Plans are the steps that SQL Server takes in order to return the requested information."
How do I see Execution Plans
For Graphical Execution Plans there are a few ways:
In the Menu Bar choose Query and you can choose either Display Estimated Execution Plan or Include Actual Execution Plan.
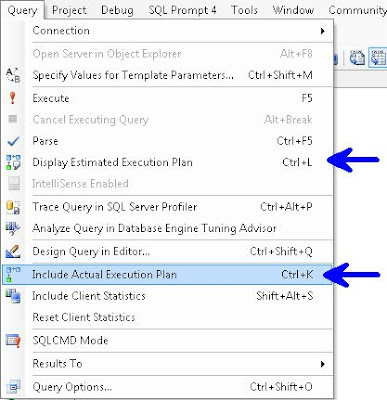
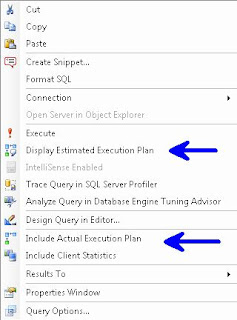
Right Click Query Window
Control L (Estimated) / M (Actual)
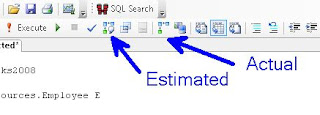
Or the simplest way, use the two buttons
Plan Type
Graphical, Text, XML
Gets more difficult to read as you go from left to right, but also get more info. i.e. Graphical is easier to read than is Text, which is easier to read than XML, but XML gives more info than Text, which in turn gives more info than Graphical.
Note: I've read that Microsoft is planning on deprecating Text Execution Plan
Permission
sysadmin, dbcreator or db_owner, or be granted the ShowPlan permission:
GRANT SHOWPLAN TO [username]
Reuse
The Optimizer stores plans so it can reuse them, this is removed on server restart or DBCC FREEPROCCACHE
The examples below use AdventureWorks and AdventureWorks2008, available at CodePlex
To start, please turn on Include Actual Execution Plan from any of the above described methods. Next run this query:
In your results window, you will see a new tab called "Execution Plan", if you click on that, you should see the following. Hovering over the left most object will display the tool tip in this screenshot:
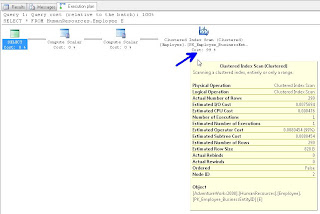
If you right click on any of the objects in this window you can choose Properties and get additional info. I traditionally read from right to left, but you can get important info like "Optimization Level" if you get the properties from the left most (select) object. The most common Optimization Levels are Trivial or Full. This is a trivial plan because there are no where clauses or joins, so the Optimizer can only get this data one way, doing a full table scan.
We discussed the difference between A Scan and a Seek. A Scan means that SQL Server needed to look at every record in the table, where as a Seek means that it can use an index to go directly to the record in question. We likened this to a phone book, if you are looking for the phone number and address for "Sam Smith", a Scan means you have to look at every page and every record even after it already finds a record for Sam Smith, whereas a Seek can go right to the S's at the top of the page and quickly go to the Sam Smith record and stop looking.
We discussed how typically, a scan performs worse than a seek. However if the table is small, and in some other instances, a Scan can be the best option.
Next we ran the following query:
And we saw an Clustered Index Seek this time.
Our next query:
Showed us the "Missing Index" at the top of the Execution Plan
You can right click on this "Missing Index" text and "Missing Index Details" to have it open the suggested index in a new window.
We altered the index slightly (gave it a name and the WITH(Data_Compression=ROW) hint) and ran this:
We then re-ran Query 3 and saw that we now have an Index Seek.
For Query 4 we ran:
Which showed us a Clustered Index Scan on HumanResources.Employee
It didn't state a missing index so we discussed how to come up with our own index.
We started by noticing that ContactID and ManagerID were both being Joined, and that ManagerID was in the WHERE clause, so we created an index on that, also we used INCLUDE (Title) because Title was in the select List:
We did discuss some of the WITH parts, like the use of ONLINE = ON as a hint to try to make this index without causing any locking if possible.
After we ran this, we noted that the Index Scan still existed; we discussed that because the ContactID wasn't part of the WHERE, it should go in the INCLUDE. After making this change and re-running the index we saw it change to a Index Seek (note I'm using the DROP_EXISTING = ON here rather than the DROP statement I used in class).
We noted that the when we hover over the Employee object in the above screen shots, that it the Estimated I/O Cost dropped from 0.0075 to 0.00386 after we converted from a SCAN to a SEEK and the Estimated Operator Cost changed from .008 to .004 We acknowledged that these numbers seem small, but if this table explodes and becomes very large, we would expect to see these go up and seeing the costs cut in half is a good thing.
For Query 5 we let the audience try to determine what was wrong and needed to be changed:
We had a big Execution Plan, we discussed that you can click on the [+] symbol at the bottom left of the window to help scroll around:
We all agreed that the Index Scan's had to go. We also introduced the "Key Lookup" object. I discussed how Key Lookups are not good, and indicate that the Optimizer couldn't get the key from the index. After looking at the query, we decided to add a number of indexes:
This did seem to help, when we compared the Estimated I/O's and CPU's but we still were seeing SCANS.
We scratched our heads and then realized that we didn't have a WHERE clause, so we were pulling every record possible. We added:
WHERE SOH.SalesOrderID = 22
and our Execution Plan looked much, much better.
By this time, I think you can figure out what needs to be done for Query 6:
Next I showed this query which returns all the Cached plans that SQL Server has ready to go:
Then we moved on to looking at Execution Plans returned as Text (Note remember to turn off "Include Actual Execution Plan"):
We saw a bunch of data returned

We next moved on to XML Plans:
If you click on the returned XML it will open in Graphical Format. If you really want to see it in XML, when viewing a plan in Graphical Format, right click on a blank part of the screen and choose "Show Execution Plan XML"
I had two more pretty awesome queries to show you...the first was one that finds all "Missing Indexes" for all Databases.
And a query that can show you indexes which potentially are no longer used:
Remember that the numbers returned are since the last restart or DBCC FREEPROCCACHE so if you did that recently, don't trust these too much. Look at user_seeks, user_scans and user_lookups to see how often users have called this index. As always, do your research, this is a tool to help you identify probable indexes which might be unused.
I want to really thank Grant Fritchey, who literally wrote the book on Execution Plans, check out his stuff, he knows way more than I do about it.
http://www.simple-talk.com/author/grant-fritchey/
http://www.simple-talk.com/sql/performance/execution-plan-basics/
http://Scarydba.com/Resources
Lastly, if you are not already a member of PASS or PASSMN, please signup, it's free and we have monthly meetings where we discuss stuff and show code and talk about new stuff...it's a lot of fun. Also, PASS does something called 24 hours of pass, where they do 24 hourly webinars (over 2 days), for free!!! so sign up and check them out.
Please subscribe to my blog and follow me on Twitter (@EricZierdt).
Comment, or email me any questions.
What are Execution Plans?
The definition I used in my presentation was:
"In simplest terms, Execution Plans are the steps that SQL Server takes in order to return the requested information."
How do I see Execution Plans
For Graphical Execution Plans there are a few ways:
In the Menu Bar choose Query and you can choose either Display Estimated Execution Plan or Include Actual Execution Plan.

Right Click Query Window

Control L (Estimated) / M (Actual)
Or the simplest way, use the two buttons

Plan Type
Graphical, Text, XML
Gets more difficult to read as you go from left to right, but also get more info. i.e. Graphical is easier to read than is Text, which is easier to read than XML, but XML gives more info than Text, which in turn gives more info than Graphical.
Note: I've read that Microsoft is planning on deprecating Text Execution Plan
Permission
sysadmin, dbcreator or db_owner, or be granted the ShowPlan permission:
GRANT SHOWPLAN TO [username]
Reuse
The Optimizer stores plans so it can reuse them, this is removed on server restart or DBCC FREEPROCCACHE
The examples below use AdventureWorks and AdventureWorks2008, available at CodePlex
To start, please turn on Include Actual Execution Plan from any of the above described methods. Next run this query:
/* QUERY 1 */
USE AdventureWorks2008
SELECT  *
FROM    HumanResources.Employee E
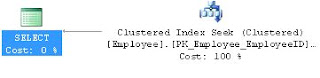
In your results window, you will see a new tab called "Execution Plan", if you click on that, you should see the following. Hovering over the left most object will display the tool tip in this screenshot:

If you right click on any of the objects in this window you can choose Properties and get additional info. I traditionally read from right to left, but you can get important info like "Optimization Level" if you get the properties from the left most (select) object. The most common Optimization Levels are Trivial or Full. This is a trivial plan because there are no where clauses or joins, so the Optimizer can only get this data one way, doing a full table scan.
We discussed the difference between A Scan and a Seek. A Scan means that SQL Server needed to look at every record in the table, where as a Seek means that it can use an index to go directly to the record in question. We likened this to a phone book, if you are looking for the phone number and address for "Sam Smith", a Scan means you have to look at every page and every record even after it already finds a record for Sam Smith, whereas a Seek can go right to the S's at the top of the page and quickly go to the Sam Smith record and stop looking.
We discussed how typically, a scan performs worse than a seek. However if the table is small, and in some other instances, a Scan can be the best option.
Next we ran the following query:
/* QUERY 2 */
USE AdventureWorks
SELECT  E.Title
FROM    HumanResources.Employee E
WHERE   E.EmployeeID = 185
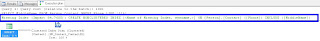
And we saw an Clustered Index Seek this time.

Our next query:
/* QUERY 3 */
USE AdventureWorks
SELECT  MiddleName
FROM    Person.Contact
WHERE   Phone LIKE '11%'
Showed us the "Missing Index" at the top of the Execution Plan

You can right click on this "Missing Index" text and "Missing Index Details" to have it open the suggested index in a new window.
We altered the index slightly (gave it a name and the WITH(Data_Compression=ROW) hint) and ran this:
USE [AdventureWorks]
GO
CREATE NONCLUSTERED INDEX [Contact_IX_Phone] ON [Person].[Contact]
(
 [Phone]
)
INCLUDE
(
 [MiddleName]
)
WITH(Data_Compression=ROW)
GO
We then re-ran Query 3 and saw that we now have an Index Seek.
For Query 4 we ran:
/* QUERY 4 */
USE AdventureWorks
SELECT  E.Title
       ,C.FirstName
       ,C.LastName
       ,M.FirstName AS ManagerFirstName
       ,M.LastName AS ManagerLastName
       ,E.ManagerID
FROM    HumanResources.Employee E
JOIN    Person.Contact C ON E.ContactID = C.ContactID
JOIN    Person.Contact M ON E.ManagerID = M.ContactID
WHERE   E.ManagerID = 109
  AND EXISTS (
   SELECT 1
   FROM Person.Contact AS C2
   WHERE E.ContactID = C2.ContactID
  )
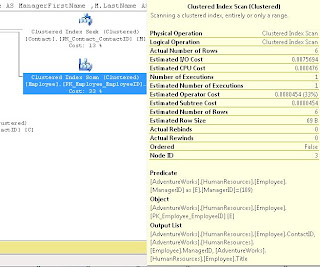
Which showed us a Clustered Index Scan on HumanResources.Employee

It didn't state a missing index so we discussed how to come up with our own index.
We started by noticing that ContactID and ManagerID were both being Joined, and that ManagerID was in the WHERE clause, so we created an index on that, also we used INCLUDE (Title) because Title was in the select List:
USE [AdventureWorks]
GO
CREATE NONCLUSTERED INDEX [HR-Employee_IX_EZ1] ON [HumanResources].[Employee]
(
 [ContactID] ASC, [ManagerID] ASC
)
INCLUDE ( [Title])
WITH (STATISTICS_NORECOMPUTE  = OFF, SORT_IN_TEMPDB = OFF, IGNORE_DUP_KEY = OFF, DROP_EXISTING = OFF, ONLINE = ON, ALLOW_ROW_LOCKS  = ON, ALLOW_PAGE_LOCKS  = ON, DATA_COMPRESSION=ROW) ON [PRIMARY]
GO
We did discuss some of the WITH parts, like the use of ONLINE = ON as a hint to try to make this index without causing any locking if possible.
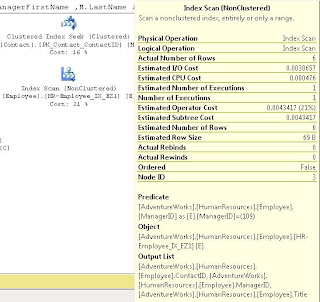
After we ran this, we noted that the Index Scan still existed; we discussed that because the ContactID wasn't part of the WHERE, it should go in the INCLUDE. After making this change and re-running the index we saw it change to a Index Seek (note I'm using the DROP_EXISTING = ON here rather than the DROP statement I used in class).
USE [AdventureWorks]
GO
CREATE NONCLUSTERED INDEX [HR-Employee_IX_EZ1] ON [HumanResources].[Employee]
(
 [ManagerID] ASC
)
INCLUDE ( [ContactID], [Title])
WITH (STATISTICS_NORECOMPUTE  = OFF, SORT_IN_TEMPDB = OFF, IGNORE_DUP_KEY = OFF, DROP_EXISTING = ON, ONLINE = ON, ALLOW_ROW_LOCKS  = ON, ALLOW_PAGE_LOCKS  = ON, DATA_COMPRESSION=ROW) ON [PRIMARY]
GO

We noted that the when we hover over the Employee object in the above screen shots, that it the Estimated I/O Cost dropped from 0.0075 to 0.00386 after we converted from a SCAN to a SEEK and the Estimated Operator Cost changed from .008 to .004 We acknowledged that these numbers seem small, but if this table explodes and becomes very large, we would expect to see these go up and seeing the costs cut in half is a good thing.
For Query 5 we let the audience try to determine what was wrong and needed to be changed:
/* QUERY 5 */
USE AdventureWorks2008
SELECT  SOH.AccountNumber
       ,S.Name AS StoreName
       ,SOH.OrderDate
       ,P.Name AS ProductName
       ,SOD.OrderQty
       ,SOD.UnitPrice
       ,SOD.LineTotal
FROM    Sales.SalesOrderHeader SOH
JOIN    Sales.SalesOrderDetail SOD ON SOH.SalesOrderID = SOD.SalesOrderID
JOIN    Sales.Customer C ON SOH.CustomerID = C.CustomerID
JOIN    Sales.Store S ON C.StoreID = S.BusinessEntityID
JOIN    Production.Product P ON SOD.ProductID = P.ProductID
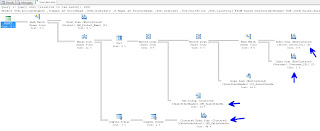
We had a big Execution Plan, we discussed that you can click on the [+] symbol at the bottom left of the window to help scroll around:

We all agreed that the Index Scan's had to go. We also introduced the "Key Lookup" object. I discussed how Key Lookups are not good, and indicate that the Optimizer couldn't get the key from the index. After looking at the query, we decided to add a number of indexes:
USE [AdventureWorks2008]
GO
CREATE NONCLUSTERED INDEX [SalesOrderHeader_I01] ON [Sales].[SalesOrderHeader]
(
[SalesOrderID] ASC,
[CustomerID] ASC
)
INCLUDE
(
AccountNumber
,OrderDate
)
WITH (STATISTICS_NORECOMPUTE  = OFF, SORT_IN_TEMPDB = OFF, IGNORE_DUP_KEY = OFF, DROP_EXISTING = OFF, ONLINE = OFF
, ALLOW_ROW_LOCKS  = ON, ALLOW_PAGE_LOCKS  = ON, DATA_COMPRESSION = ROW) ON [PRIMARY]
GO


USE [AdventureWorks2008]
GO
/****** Object:  Index [AK_SalesOrderDetail_rowguid]    Script Date: 09/23/2011 14:35:47 ******/
CREATE NONCLUSTERED INDEX [SalesOrderDetail_I01] ON [Sales].[SalesOrderDetail]
(
SalesOrderID ASC
)
INCLUDE
(
ProductID
, OrderQty
,UnitPrice
,LineTotal
)
WITH (PAD_INDEX  = OFF, STATISTICS_NORECOMPUTE  = OFF, SORT_IN_TEMPDB = OFF, IGNORE_DUP_KEY = OFF, DROP_EXISTING = OFF
, ONLINE = OFF, ALLOW_ROW_LOCKS  = ON, ALLOW_PAGE_LOCKS  = ON, DATA_COMPRESSION = ROW) ON [PRIMARY]
GO


USE [AdventureWorks2008]
GO
CREATE NONCLUSTERED INDEX [Customer_I01] ON [Sales].[Customer]
(
[CustomerID] ASC)
INCLUDE (
[StoreID]
)WITH (STATISTICS_NORECOMPUTE  = OFF, SORT_IN_TEMPDB = OFF, IGNORE_DUP_KEY = OFF, DROP_EXISTING = OFF, ONLINE = OFF
, ALLOW_ROW_LOCKS  = ON, ALLOW_PAGE_LOCKS  = ON, DATA_COMPRESSION = ROW) ON [PRIMARY]
GO


USE [AdventureWorks2008]
GO
CREATE NONCLUSTERED INDEX [Store_I01] ON [Sales].[Store]
(
[BusinessEntityID] ASC
)
INCLUDE
(
Name
)
WITH (STATISTICS_NORECOMPUTE  = OFF, SORT_IN_TEMPDB = OFF, IGNORE_DUP_KEY = OFF, DROP_EXISTING = OFF, ONLINE = OFF
, ALLOW_ROW_LOCKS  = ON, ALLOW_PAGE_LOCKS  = ON, DATA_COMPRESSION = ROW) ON [PRIMARY]
GO
This did seem to help, when we compared the Estimated I/O's and CPU's but we still were seeing SCANS.

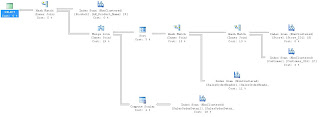
We scratched our heads and then realized that we didn't have a WHERE clause, so we were pulling every record possible. We added:
WHERE SOH.SalesOrderID = 22
and our Execution Plan looked much, much better.
By this time, I think you can figure out what needs to be done for Query 6:
/* QUERY 6 */
SELECT LineTotal, OrderQty
FROM Sales.SalesOrderDetail s
JOIN Production.Product p ON s.ProductID = p.ProductID
WHERE CarrierTrackingNumber = '4911-403C-98'
Next I showed this query which returns all the Cached plans that SQL Server has ready to go:
SELECT [cp].[refcounts]
  , [cp].[usecounts]
  , [cp].[objtype]
  , [st].[dbid]
  , [st].[objectid]
  , [st].[text]
  , [qp].[query_plan]
FROM sys.dm_exec_cached_plans cp
CROSS APPLY sys.dm_exec_sql_text ( cp.plan_handle ) st
CROSS APPLY sys.dm_exec_query_plan ( cp.plan_handle ) qp ;
Then we moved on to looking at Execution Plans returned as Text (Note remember to turn off "Include Actual Execution Plan"):
/* TEXT PLANS */

SET SHOWPLAN_ALL ON;   --TURNS ON Estimated Exececution Plan

USE AdventureWorks2008
SELECT  *
FROM    HumanResources.Employee E

SET SHOWPLAN_ALL OFF;  --TURNS OFF Estimated Exececution Plan


SET STATISTICS PROFILE ON  --TURNS ON Actual Exececution Plan
USE AdventureWorks2008
SELECT  *
FROM    HumanResources.Employee E
SET STATISTICS PROFILE OFF --TURNS OFF Actual Exececution Plan
We saw a bunch of data returned

We next moved on to XML Plans:
/* XML PLANS */
SET SHOWPLAN_XML ON;   --TURNS ON Estimated Exececution Plan

USE AdventureWorks2008
SELECT  *
FROM    HumanResources.Employee E

SET SHOWPLAN_XML OFF;  --TURNS OFF Estimated Exececution Plan


SET STATISTICS XML ON  --TURNS ON Actual Exececution Plan
USE [AdventureWorks]
SELECT  E.Title
       ,C.FirstName
       ,C.LastName
FROM    HumanResources.Employee E
JOIN    Person.Contact C ON E.ContactID = C.ContactID
WHERE   E.ManagerID = 185
SET STATISTICS XML OFF --TURNS OFF Actual Exececution Plan

If you click on the returned XML it will open in Graphical Format. If you really want to see it in XML, when viewing a plan in Graphical Format, right click on a blank part of the screen and choose "Show Execution Plan XML"
I had two more pretty awesome queries to show you...the first was one that finds all "Missing Indexes" for all Databases.
SELECT  TOP 10 SUBSTRING(mid.statement, 2, (CHARINDEX(']',mid.statement,1)-2)) AS DBName
  ,mid.statement
  ,migs.avg_total_user_cost
  ,migs.avg_user_impact
  ,migs.user_seeks
  ,migs.avg_total_user_cost * (migs.avg_user_impact / 100.0)
   * (migs.user_seeks + migs.user_scans) AS improvement_measure
       ,'CREATE INDEX [missing_index_'
   + CONVERT (VARCHAR, mig.index_group_handle) + '_'
   + CONVERT (VARCHAR, mid.index_handle) + '_'
   + LEFT(PARSENAME(mid.statement, 1), 32) + ']' + ' ON ' + mid.statement
   + ' (' + ISNULL(mid.equality_columns, '')
   + CASE WHEN mid.equality_columns IS NOT NULL
      AND mid.inequality_columns IS NOT NULL THEN ','
       ELSE ''
     END + ISNULL(mid.inequality_columns, '') + ')' + ISNULL(' INCLUDE ('
                  + mid.included_columns
                  + ')', '') AS create_index_statement
       ,migs.*
       ,mid.database_id
       ,mid.[object_id]
FROM    sys.dm_db_missing_index_groups mig
INNER JOIN sys.dm_db_missing_index_group_stats migs ON migs.group_handle = mig.index_group_handle
INNER JOIN sys.dm_db_missing_index_details mid ON mig.index_handle = mid.index_handle
WHERE   migs.avg_total_user_cost * (migs.avg_user_impact / 100.0)
        * (migs.user_seeks + migs.user_scans) > 1
ORDER BY migs.avg_total_user_cost * migs.avg_user_impact * (migs.user_seeks  + migs.user_scans) DESC
And a query that can show you indexes which potentially are no longer used:
IF EXISTS (SELECT * FROM tempdb.dbo.sysobjects WHERE ID = OBJECT_ID(N'tempdb..#Temp_UnUsed_Indexes'))
BEGIN
 DROP TABLE #Temp_UnUsed_Indexes
END

CREATE TABLE #Temp_UnUsed_Indexes
(
 [Server] VARCHAR(100)
 , DatabaseName VARCHAR(100)
 , TableName VARCHAR(100)
 , IndexName VARCHAR(100)
 , is_primary_key BIT
 , user_seeks INT
 , user_scans INT
 , user_lookups INT
 , user_updates INT
 , last_user_seek DATETIME
 , last_user_scan DATETIME
 , last_user_lookup DATETIME
 , last_user_update DATETIME
 , system_seeks INT
 , system_scans INT
 , system_lookups INT
 , system_updates INT
 , last_system_seek DATETIME
 , last_system_scan DATETIME
 , last_system_lookup DATETIME
 , last_system_update DATETIME
)

SET NOCOUNT ON
DECLARE @Seeks INT = 30
  ,@Scans INT = 30
  ,@Lookups INT = 30
  ,@DBName VARCHAR(MAX)
  ,@SQL VARCHAR(MAX)

DECLARE ZCursor CURSOR FOR
 SELECT NAME --select *
 FROM sys.databases
 WHERE owner_sid <> 0x01
   AND is_read_only = 0
   AND user_access = 0
 ORDER BY name
OPEN ZCursor
FETCH NEXT FROM ZCursor INTO @DBName
WHILE @@FETCH_STATUS = 0
BEGIN
 SET @SQL = '
USE [' + @DBName + ']
DECLARE @Seeks INT = ' + CAST(@Seeks AS VARCHAR(20)) + '
  ,@Scans INT = ' + CAST(@Scans AS VARCHAR(20)) + '
  ,@Lookups INT = ' + CAST(@Lookups AS VARCHAR(20)) + '

INSERT INTO #Temp_UnUsed_Indexes
SELECT  @@SERVERNAME     AS SERVER
  , DB_NAME(DDIUS.database_id) AS DatabaseName
  , OBJECT_NAME(DDIUS.object_id) AS TableName
  , I.name      AS IndexName
  , I.is_primary_key    AS is_primary_key
  , DDIUS.user_seeks    AS user_seeks
  , DDIUS.user_scans    AS user_scans
  , DDIUS.user_lookups   AS user_lookups
  , DDIUS.user_updates   AS user_updates
  , DDIUS.last_user_seek   AS last_user_seek
  , DDIUS.last_user_scan   AS last_user_scan
  , DDIUS.last_user_lookup  AS last_user_lookup
  , DDIUS.last_user_update  AS last_user_update
  , DDIUS.system_seeks   AS system_seeks
  , DDIUS.system_scans   AS system_scans
  , DDIUS.system_lookups   AS system_lookups
  , DDIUS.system_updates   AS system_updates
  , DDIUS.last_system_seek  AS last_system_seek
  , DDIUS.last_system_scan  AS last_system_scan
  , DDIUS.last_system_lookup  AS last_system_lookup
  , DDIUS.last_system_update  AS last_system_update
FROM    sys.dm_db_index_usage_stats AS DDIUS
JOIN sys.indexes AS I ON DDIUS.index_id = I.index_id AND DDIUS.object_id = I.object_id
WHERE   database_id = DB_ID()
  AND user_seeks <= @Seeks AND user_scans <= @Scans AND user_lookups <= @Lookups
  --AND is_primary_key = 0
ORDER BY OBJECT_NAME(DDIUS.object_id), I.name
'
 EXEC(@SQL)
 -- PRINT @SQL

 FETCH NEXT FROM ZCursor INTO @DBName
END
CLOSE ZCursor
DEALLOCATE ZCursor


SELECT  *
FROM    #Temp_UnUsed_Indexes
WHERE is_primary_key = 0
  --AND user_seeks = 0 AND user_scans = 0 AND user_lookups = 0
  --AND system_seeks = 0 AND system_scans = 0 AND system_lookups = 0
  --AND DatabaseName NOT IN ('MOBILE')
ORDER BY [SERVER]
     ,DatabaseName
     ,TableName
     ,is_primary_key DESC
     ,IndexName
Remember that the numbers returned are since the last restart or DBCC FREEPROCCACHE so if you did that recently, don't trust these too much. Look at user_seeks, user_scans and user_lookups to see how often users have called this index. As always, do your research, this is a tool to help you identify probable indexes which might be unused.
I want to really thank Grant Fritchey, who literally wrote the book on Execution Plans, check out his stuff, he knows way more than I do about it.
http://www.simple-talk.com/author/grant-fritchey/
http://www.simple-talk.com/sql/performance/execution-plan-basics/
http://Scarydba.com/Resources
Lastly, if you are not already a member of PASS or PASSMN, please signup, it's free and we have monthly meetings where we discuss stuff and show code and talk about new stuff...it's a lot of fun. Also, PASS does something called 24 hours of pass, where they do 24 hourly webinars (over 2 days), for free!!! so sign up and check them out.
Please subscribe to my blog and follow me on Twitter (@EricZierdt).
Comment, or email me any questions.
Thursday, November 10, 2011
New SP_WHO2
A long time ago, I was given a stored proc called "SP_WHOM" which said it was created by "MFrank". SP_WHOM has been a staple in my collection of utilities I use to debug issues on my SQL Servers. I never paid it much mind, until recently, when the thought occurred to me that I knew how to get all of the provided data from SP_WHOM, in an easier way, and I could add some beneficial new fields in the process. So I set out to try to design my own SP_WHOM, so I took at look at the fields provided in the DMV sys.sysprocess All the fields I wanted were in there; so I decided to design my own and this is what I came up with:
Why are you doing a UNION you might ask? I'm doing it because I want to display only those SPIDS which are not set to "Sleeping" or "Background" status, however...if a SPID is blocked by another SPID, I'd like to display the blocking SPID as well. If I didn't do this and someone opens a transaction, updates records and doesn't close the transaction, their SPID's status will be Sleeping, so you will see that any spid trying to access the record(s) are blocked, but you won't know anything about the SPID doing the blocking.
I'd love feedback, is there something I should add to this to make it more useful? Please follow my blog and leave me some feedback.
P.s. because this is being placed in the master database and has the sp_ prefix you can call this from any database by just executing: "sp_whom" no need for exec or master.. or anything.
USE [master]
GO

SET ANSI_NULLS ON
GO

SET QUOTED_IDENTIFIER ON
GO

/*******************************
** Created By: Eric Zierdt **
** ericzierdt@gmail.com **
** ericemployed.blogspot.com **
*******************************/
CREATE PROCEDURE [dbo].[sp_whom]
AS

SET NOCOUNT ON

IF EXISTS (SELECT * FROM tempdb.dbo.sysobjects WHERE ID = OBJECT_ID(N'tempdb..#RawData'))
BEGIN
 DROP TABLE #RawData
END

SELECT SPID
  ,UPPER(status) AS Status
  ,LogiName
  ,HostName
  ,CASE blocked
   WHEN 0 THEN ''
   ELSE CAST(blocked AS VARCHAR(5))
  END AS BlockedBy
  ,Open_Tran
  ,DB_NAME(S.dbid) AS DBName
  ,CMD AS Command
  ,Last_Batch
  ,DATEDIFF(mi,last_batch,GETDATE()) AS RunTimeMins
  ,DATEDIFF(ss,last_batch,GETDATE()) AS RunTimeSecs
  ,CPU AS CPU_Time
  ,Physical_IO AS DiskIO
  ,Program_Name
  ,ST.text AS SQL_Text
INTO #RawData
FROM    sys.sysprocesses AS S
CROSS APPLY sys.dm_exec_sql_text(S.sql_handle) ST

SELECT *
FROM #RawData R
WHERE   spid <> @@SPID
  AND status NOT IN ( 'background', 'sleeping' )
UNION
SELECT *
FROM #RawData AS RD
WHERE SPID IN (
   SELECT BlockedBy
   FROM #RawData AS RD2
   WHERE RD2.BlockedBy <> ''
  )
ORDER BY SPID

DROP TABLE #RawData

GO
Why are you doing a UNION you might ask? I'm doing it because I want to display only those SPIDS which are not set to "Sleeping" or "Background" status, however...if a SPID is blocked by another SPID, I'd like to display the blocking SPID as well. If I didn't do this and someone opens a transaction, updates records and doesn't close the transaction, their SPID's status will be Sleeping, so you will see that any spid trying to access the record(s) are blocked, but you won't know anything about the SPID doing the blocking.
I'd love feedback, is there something I should add to this to make it more useful? Please follow my blog and leave me some feedback.
P.s. because this is being placed in the master database and has the sp_ prefix you can call this from any database by just executing: "sp_whom" no need for exec or master.. or anything.
Tuesday, November 2, 2010
SQLSaturday #58 Presentation
Last Friday I had the opportunity to present a track on Table and index partitioning at SQLSaturday #58 (yes, SQLSaturday on a Friday) in Minnesota.
I had a great time, met a lot of great people and found the entire experience very enjoyable; I want to present more.
I said I'd put my queries up on my blog; so here it is.
Script 1 which was here is how to create a very basic partition and add values to it and move it (create a folder on your c drive called: PartitionDB prior to starting
Note that the USE Master at the bottom is so that in the next script (which I had in different files/tabs) when you drop the DB, you don't have an error about someone being connected.
Script 2 was used to demonstrate large volume of data being merged and split and how quickly the data goes from one table to another when you use the ALTER TABLE - SWITCH. When I gave the presentation, I had a subfolder created previously that had a Database with 8 Million rows already created. This wont work over the blog, so you'll need to create the table and dump in the 8M rows yourself....So I'm taking out the part about dropping the table and attaching the other database.
Script 3 is a real life example of how my company uses Partitioning. It uses a date based range; and shows the process we use to move and drop the oldest data:
The final script was a script to show how many records are in each filegroup/range; I find it is very useful for me for many different situations.
I had a great time, met a lot of great people and found the entire experience very enjoyable; I want to present more.
I said I'd put my queries up on my blog; so here it is.
Script 1 which was here is how to create a very basic partition and add values to it and move it (create a folder on your c drive called: PartitionDB prior to starting
/**************************************
** Database Partitioning Script      **
** Eric Zierdt, W3i            **
** http://ericemployed.blogspot.com  **
** http://blog.w3i.com               **
**************************************/
USE master
GO
CREATE DATABASE PartitionDB ON
PRIMARY(NAME = db_data, FILENAME = 'c:\PartitionDB\db.mdf' ,SIZE = 25MB)
, FILEGROUP FG1( NAME = FG1_data, FILENAME = 'c:\PartitionDB\FG1.ndf' ,SIZE = 25MB)
, FILEGROUP FG2( NAME = FG2_data, FILENAME = 'c:\PartitionDB\FG2.ndf', SIZE = 25MB)
, FILEGROUP FG3( NAME = FG3_data, FILENAME = 'c:\PartitionDB\FG3.ndf', SIZE = 25MB)
, FILEGROUP FG4( NAME = FG4_data, FILENAME = 'c:\PartitionDB\FG4.ndf', SIZE = 25MB)
, FILEGROUP FG5( NAME = FG5_data, FILENAME = 'c:\PartitionDB\FG5.ndf', SIZE = 25MB)
, FILEGROUP FGDefault( NAME = FGDefault_data, FILENAME = 'c:\PartitionDB\FGDefault.ndf', SIZE = 25MB)
LOG ON( NAME = db_log, FILENAME = 'c:\PartitionDB\log.ldf', SIZE = 1MB,FILEGROWTH = 100MB ) ;
GO
USE PartitionDB
GO

CREATE PARTITION FUNCTION EZ_PartitionFunction (INT) AS
RANGE RIGHT FOR VALUES (1000, 2000, 3000, 4000, 5000);

CREATE PARTITION SCHEME EZ_PartitionScheme AS
PARTITION EZ_PartitionFunction TO([FGDefault],[FG1], [FG2], [FG3], [FG4], [FG5])
GO


CREATE TABLE EZ_PartionedTable
( ID int PRIMARY KEY,
  Name VARCHAR(50)
)
ON EZ_PartitionScheme(ID)


INSERT INTO EZ_PartionedTable (ID,NAME)
VALUES (1,'Test')
,(1001,'Test')
,(2001,'Test')
,(3001,'Test')
,(4001,'Test')
,(5001,'Test')
,(6001,'Test')
,(7001,'Test')
,(8001,'Test')

USE [master]
GO
ALTER DATABASE [PartitionDB] ADD FILEGROUP [FG6]
GO
ALTER DATABASE [PartitionDB] ADD FILE ( NAME = N'FG6_data', FILENAME = N'C:\PartitionDB\FG6.ndf' , SIZE = 25MB , FILEGROWTH = 5MB )
TO FILEGROUP [FG6]
GO
USE PartitionDB
GO

-- Adding a new Scheme and Function
ALTER PARTITION SCHEME EZ_PartitionScheme NEXT USED [FG6]

ALTER PARTITION FUNCTION EZ_PartitionFunction() SPLIT RANGE (6000)


-- Removing a Scheme and Function
ALTER PARTITION FUNCTION EZ_PartitionFunction() MERGE RANGE (6000)


-- Adding a new Scheme and Function
ALTER PARTITION SCHEME EZ_PartitionScheme NEXT USED [FG6]

ALTER PARTITION FUNCTION EZ_PartitionFunction() SPLIT RANGE (6000)

-- Removing a Scheme and Function out of Sequence
ALTER PARTITION FUNCTION EZ_PartitionFunction ()MERGE RANGE (5000)


ALTER PARTITION SCHEME EZ_PartitionScheme NEXT USED [FG5]

ALTER PARTITION FUNCTION EZ_PartitionFunction() SPLIT RANGE (5000)

USE master
GO
Note that the USE Master at the bottom is so that in the next script (which I had in different files/tabs) when you drop the DB, you don't have an error about someone being connected.
Script 2 was used to demonstrate large volume of data being merged and split and how quickly the data goes from one table to another when you use the ALTER TABLE - SWITCH. When I gave the presentation, I had a subfolder created previously that had a Database with 8 Million rows already created. This wont work over the blog, so you'll need to create the table and dump in the 8M rows yourself....So I'm taking out the part about dropping the table and attaching the other database.
/**************************************
** Database Partitioning Script      **
** Eric Zierdt, W3i       **
** http://ericemployed.blogspot.com  **
** http://blog.w3i.com               **
**************************************/

/*** DROP TABLE AND PARTITION ***/
USE PartitionDB
DROP TABLE EZ_PartionedTable
DROP PARTITION SCHEME EZ_PartitionScheme
DROP PARTITION FUNCTION EZ_PartitionFunction
ALTER DATABASE [PartitionDB]  REMOVE FILE [FG6_data]
GO
ALTER DATABASE [PartitionDB] REMOVE FILEGROUP [FG6]
GO

/*** CREATE NEW PARTITION FUNCTION BASED ON MILLION RECORDS ***/
CREATE PARTITION FUNCTION EZ_PartitionFunction (INT) AS
RANGE RIGHT FOR VALUES (1000000, 2000000, 3000000, 4000000, 5000000);

/*** CREATE NEW PARTITION SCHEME ***/
CREATE PARTITION SCHEME EZ_PartitionScheme AS
PARTITION EZ_PartitionFunction TO([FGDefault],[FG1], [FG2], [FG3], [FG4], [FG5])
GO

/*** CREATE NEW TABLE ***/
CREATE TABLE EZ_PartionedTable
( ID int NOT NULL IDENTITY (1000000, 1),
  Name VARCHAR(50)
)
ON EZ_PartitionScheme(ID)

/*** ADD PK TO TABLE ***/
ALTER TABLE dbo.EZ_PartionedTable ADD CONSTRAINT
 PK_EZ_PartionedTable PRIMARY KEY CLUSTERED
 (
 ID
 ) WITH( STATISTICS_NORECOMPUTE = OFF, IGNORE_DUP_KEY = OFF, ALLOW_ROW_LOCKS = ON, ALLOW_PAGE_LOCKS = ON) ON EZ_PartitionScheme(ID)

GO

/*** LOAD 8 MILLION RECORDS...Go get some food, this will take a while... ***/
DECLARE @i INT = 1
WHILE @i <= 8000000
BEGIN
INSERT INTO EZ_PartionedTable (NAME)
VALUES ('Test')
SET @i += 1
END


/*** ADD A NEW FILEGROUP TO THE DATABASE ***/
USE [master]
GO
ALTER DATABASE [PartitionDB] ADD FILEGROUP [FG6]
GO
ALTER DATABASE [PartitionDB] ADD FILE ( NAME = N'FG6_data', FILENAME = N'C:\PartitionDB\FG6.ndf' , SIZE = 25MB , FILEGROWTH = 5MB )
TO FILEGROUP [FG6]
GO
USE PartitionDB
GO


/*** ADD A NEW FILEGROUP TO THE PARTITION ***/
ALTER PARTITION SCHEME EZ_PartitionScheme NEXT USED [FG6]

ALTER PARTITION FUNCTION EZ_PartitionFunction() SPLIT RANGE (6000000)
--NOTE THE LOG WILL GROW SIGNIFIGANTLY (look in your data directory, the log will grow to around 1.2 GB)
--The point of this is to say, that you need to be careful when using SPLIT and MERGE..doing it to a an empty range is ok, but if the range has data, it's dangerous

/*** SHRINK LOG ***/
USE [PartitionDB]
GO
DBCC SHRINKFILE (N'db_log' , 1)
GO

/*** REMOVE FILEGROUP FROM THE PARTITION ***/
ALTER PARTITION FUNCTION EZ_PartitionFunction ()MERGE RANGE (6000000)

/*** SHRINK LOG ***/
USE [PartitionDB]
GO
DBCC SHRINKFILE (N'db_log' , 1)
GO

/*** SHRINK LOG ***/
USE [PartitionDB]
GO
DBCC SHRINKFILE (N'FG6_data' , 25)
GO

/*** CREATE STAGE TABLE FOR SWITCH ***/
CREATE TABLE EZ_PartionedTable_Stage
( ID int NOT NULL IDENTITY (1000000, 1),
  Name VARCHAR(50)
)
ON EZ_PartitionScheme(ID)

ALTER TABLE dbo.EZ_PartionedTable_Stage ADD CONSTRAINT
 PK_EZ_PartionedTable_Stage PRIMARY KEY CLUSTERED
 (
 ID
 ) WITH( STATISTICS_NORECOMPUTE = OFF, IGNORE_DUP_KEY = OFF, ALLOW_ROW_LOCKS = ON, ALLOW_PAGE_LOCKS = ON) ON EZ_PartitionScheme(ID)
GO

--SHOW View Table Partition Data and explain what SWITCH DOES
ALTER TABLE EZ_PartionedTable SWITCH PARTITION 6 TO EZ_PartionedTable_Stage PARTITION 6

ALTER TABLE EZ_PartionedTable_Stage SWITCH PARTITION 6 TO EZ_PartionedTable PARTITION 6

--SHOW Dropping of data and removing old file group.
ALTER TABLE EZ_PartionedTable SWITCH PARTITION 6 TO EZ_PartionedTable_Stage PARTITION 6
DROP TABLE EZ_PartionedTable_Stage

ALTER DATABASE [PartitionDB]  REMOVE FILE [FG6_data]
GO
ALTER DATABASE [PartitionDB] REMOVE FILEGROUP [FG6]
GO

/*** SHRINK LOG ***/
USE [PartitionDB]
GO
DBCC SHRINKFILE (N'FG5_data' , 25)
GO

USE master
GO
Script 3 is a real life example of how my company uses Partitioning. It uses a date based range; and shows the process we use to move and drop the oldest data:
/**************************************
** Database Partitioning Script      **
** Eric Zierdt, W3i       **
** http://ericemployed.blogspot.com  **
** http://blog.w3i.com               **
**************************************/

USE master
GO
ALTER DATABASE [PartitionDB] SET  SINGLE_USER WITH ROLLBACK IMMEDIATE
GO
USE [master]
GO
DROP DATABASE PartitionDB
GO

/*** CREATE DB WITH FILEGROUP NAMES THAT ARE DATE BASED - AUGUST, SEPTEMBER AND OCTOBER 2010 ***/
CREATE DATABASE PartitionDB ON
PRIMARY(NAME = db_data, FILENAME = 'c:\PartitionDB\db.mdf' ,SIZE = 4MB)
, FILEGROUP TRANDTA_201008 ( NAME = TRANDTA_201008, FILENAME = 'c:\PartitionDB\TRANDTA_201008.ndf' ,SIZE = 25MB)
, FILEGROUP TRANDTA_201009( NAME = TRANDTA_201009, FILENAME = 'c:\PartitionDB\TRANDTA_201009.ndf', SIZE = 25MB)
, FILEGROUP TRANDTA_201010( NAME = TRANDTA_201010, FILENAME = 'c:\PartitionDB\TRANDTA_201010.ndf', SIZE = 25MB)
, FILEGROUP TRANDEFAULT( NAME = TRANDEFAULT_data, FILENAME = 'c:\PartitionDB\FGDefault.ndf', SIZE = 25MB)
LOG ON( NAME = db_log, FILENAME = 'c:\PartitionDB\log.ldf', SIZE = 1MB,FILEGROWTH = 100MB ) ;
GO
USE PartitionDB
GO

/*** MAKE A PARTITION FUNCTION WITH RANGES FOR 08,09,10 2010 ***/
CREATE PARTITION FUNCTION [EZ_PartitionFunction](DATETIME) AS RANGE RIGHT FOR VALUES (
 N'2010-08-01'
 , N'2010-09-01'
 , N'2010-10-01')
GO

/*** BIND THE SCHEME TO THE FUNCTION ***/
CREATE PARTITION SCHEME EZ_PartitionScheme AS
PARTITION EZ_PartitionFunction TO(
 [TRANDEFAULT]
 , [TRANDTA_201008]
 , [TRANDTA_201009]
 , [TRANDTA_201010])
GO

/*** CREATE A TABLE AND BIND IT TO THE PARTITION ***/
CREATE TABLE EZ_PartionedTable
( ID int,
  DateAdded DATETIME PRIMARY KEY,
  Name VARCHAR(50)
)
ON EZ_PartitionScheme(DateAdded)

/*** INSERT SOME DATA INTO THE NEW TABLE, 3 RECORDS PER MONTH ***/
INSERT INTO EZ_PartionedTable (ID,DateAdded, NAME)
VALUES (1,'08/01/2010', 'Test')
,(2,'08/10/2010','Test')
,(3,'08/31/2010','Test')
,(4,'09/01/2010','Test')
,(5,'09/15/2010','Test')
,(6,'09/30/2010 23:59:59','Test')
,(7,'10/01/2010','Test')
,(8,'10/07/2010','Test')
,(9,'10/22/2010','Test')


/*** On around the 25th of each month, we fire off an agent job that calls a
proc that makes a new month filegroup, file, function and scheme ***/
USE [master]
GO
ALTER DATABASE [PartitionDB] ADD FILEGROUP [TRANDTA_201011]
GO
ALTER DATABASE [PartitionDB] ADD FILE ( NAME = N'TRANDTA_201011', FILENAME = N'C:\PartitionDB\TRANDTA_201011.ndf' , SIZE = 25MB , FILEGROWTH = 5MB )
 TO FILEGROUP [TRANDTA_201011]
GO
USE PartitionDB
GO

ALTER PARTITION SCHEME EZ_PartitionScheme NEXT USED [TRANDTA_201011]

ALTER PARTITION FUNCTION EZ_PartitionFunction() SPLIT RANGE ('11/01/2010')


/*** INSERT A RECORD FOR OCTOBER AND CHECK THE VIEW PARTITION SCRIPT ***/
INSERT INTO EZ_PartionedTable (ID,DateAdded, NAME)
VALUES (1,'10/31/2010', 'Test')

/*** INSERT A RECORD FOR NOVEMBER AND CHECK THE VIEW PARTITION SCRIPT ***/
INSERT INTO EZ_PartionedTable (ID,DateAdded, NAME)
VALUES (2,'11/01/2010', 'Test')


/*** Within the first few days of the month we verify that the partitions are correct, then we run a proc that does this: ***/
-- MAKE A STAGING TABLE THAT IS EXACTLY THE SAME AS THE MAIN TABLE
CREATE TABLE EZ_PartionedTable_Stage
( ID int,
  DateAdded DATETIME PRIMARY KEY,
  Name VARCHAR(50)
)
ON EZ_PartitionScheme(DateAdded)

/*** SWITCH OUT THE OLDEST MONTH'S PARTITION DATA TO THE STAGING TABLE ***/
ALTER TABLE EZ_PartionedTable SWITCH PARTITION 2 TO EZ_PartionedTable_Stage PARTITION 2

/**** BCP OUT DATA (NOT SHOWN HERE) ****/

/*** DROP STAGING DATA (AND ALL THE DATA FROM THE OLDEST MONTH WITH IT) ***/
DROP TABLE EZ_PartionedTable_Stage

/*** DROP THE FUNCTION RANGE FOR THE OLDEST MONTH ***/
ALTER PARTITION FUNCTION EZ_PartitionFunction() MERGE RANGE ('8/01/2010')
GO
/*** DROP THE FILEGROUP AND FILE FOR THE OLDEST MONTH ***/
ALTER DATABASE [PartitionDB]  REMOVE FILE [TRANDTA_201008]
GO
ALTER DATABASE [PartitionDB] REMOVE FILEGROUP [TRANDTA_201008]
GO


--DMV's that are useful:

SELECT *
FROM sys.partition_functions

SELECT *
FROM sys.partition_schemes
-- Joins to Function on function_id

SELECT *
FROM sys.partition_range_values
-- Joins to Function on function_id

SELECT *
FROM sys.indexes
-- Joins to schemes on data_space_id

SELECT *
FROM sys.data_spaces
-- Joins to indexes on data_space_id

SELECT *
FROM sys.filegroups
-- Joins to indexes on data_space_id
The final script was a script to show how many records are in each filegroup/range; I find it is very useful for me for many different situations.
/**************************************
** Database Partitioning Script      **
** Eric Zierdt, W3i       **
** http://ericemployed.blogspot.com  **
** http://blog.w3i.com               **
**************************************/

USE PartitionDB
DECLARE @TableName VARCHAR(150) = '%%'
  ,@FileGroup VARCHAR(150) = '%%'

SELECT OBJECT_NAME(p.object_id) AS TableName,
  i.name AS IndexName,
  p.partition_number AS PartitionNumber,
  fg.name AS FileGroupName,
  prv_left.value AS LowerBoundaryValue,
  prv_right.value AS UpperBoundaryValue,
  p.rows AS Rows
FROM sys.partitions AS p
JOIN sys.indexes AS i ON i.object_id = p.object_id AND i.index_id = p.index_id
JOIN sys.data_spaces AS ds ON ds.data_space_id = i.data_space_id
JOIN sys.partition_schemes AS ps ON ps.data_space_id = ds.data_space_id
JOIN sys.partition_functions AS pf ON pf.function_id = ps.function_id
JOIN sys.destination_data_spaces AS dds2 ON dds2.partition_scheme_id = ps.data_space_id AND dds2.destination_id = p.partition_number
JOIN sys.filegroups AS fg ON fg.data_space_id = dds2.data_space_id
LEFT JOIN sys.partition_range_values AS prv_left ON ps.function_id = prv_left.function_id AND prv_left.boundary_id = p.partition_number - 1
LEFT JOIN sys.partition_range_values AS prv_right ON ps.function_id = prv_right.function_id AND prv_right.boundary_id = p.partition_number
WHERE OBJECTPROPERTY(p.object_id, 'ISMSShipped') = 0
  AND OBJECT_NAME(p.object_id) LIKE @TableName
  AND fg.name LIKE @FileGroup
ORDER BY TableName, IndexName, PartitionNumber;

USE master
Subscribe to:
Posts (Atom)